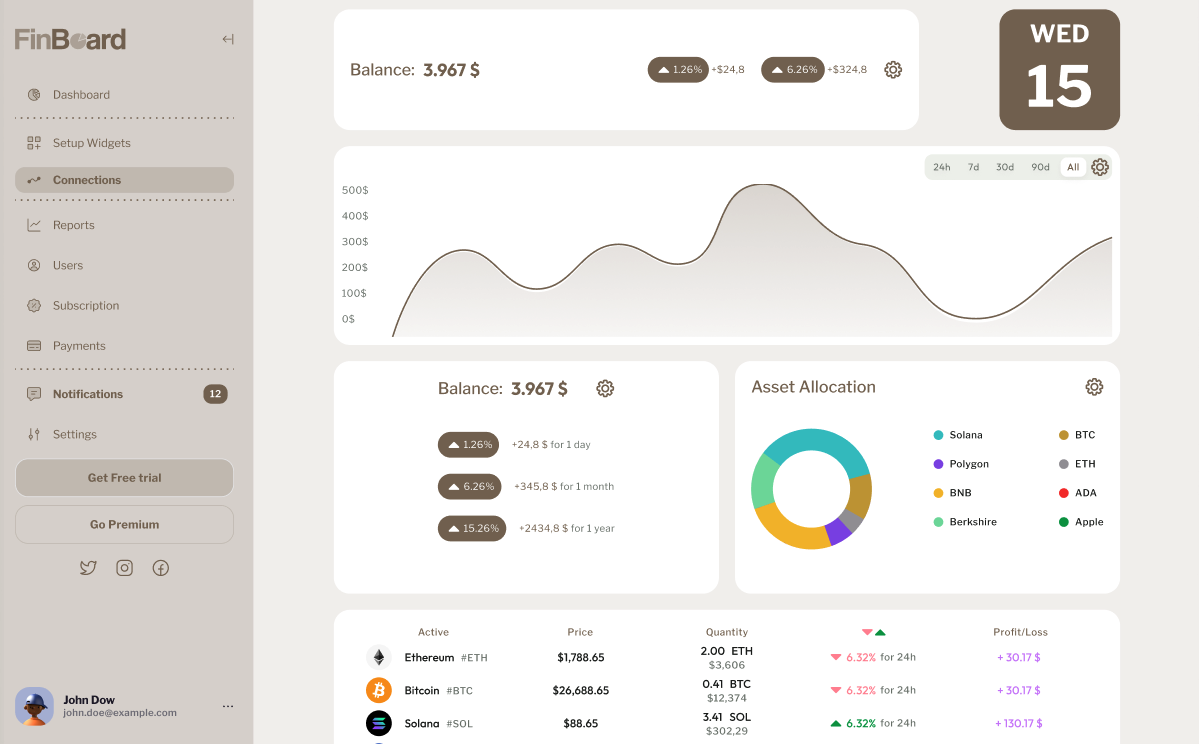
group-image
group-image
FINANCIAL DASHBOARD

All your finance together

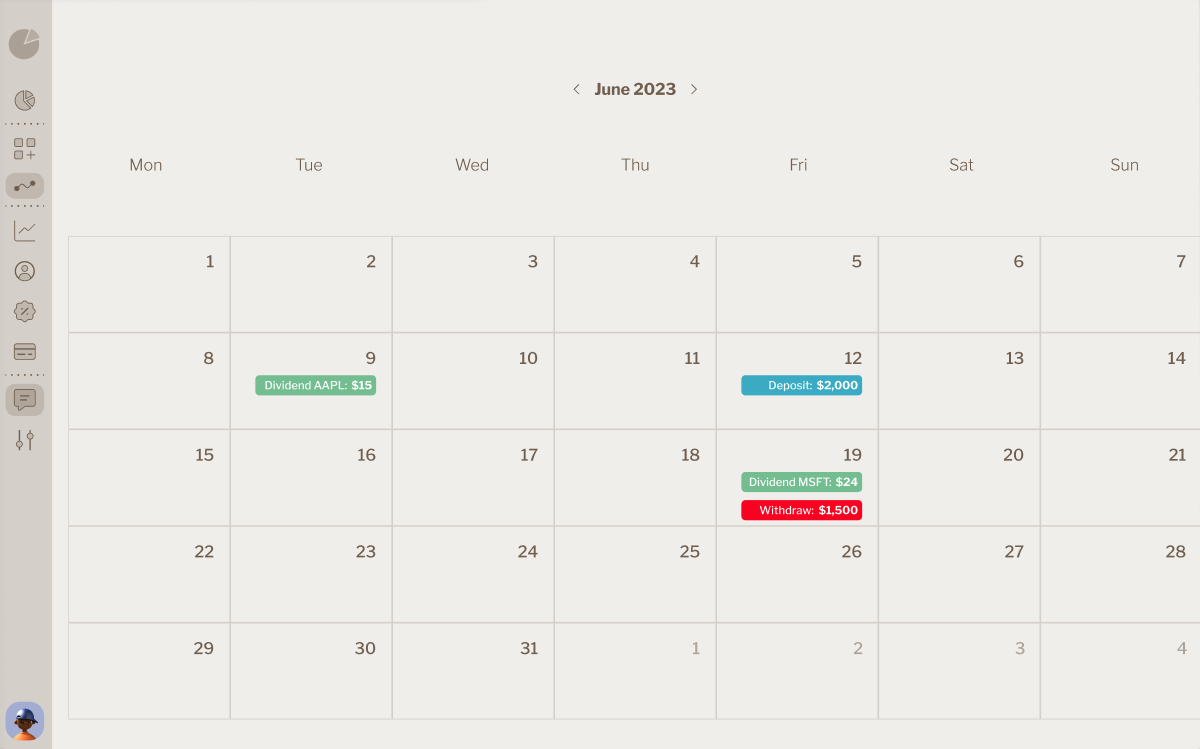
FinBoard, is your new SaaS with which you can control your finances at a glance, analyze risks, control taxation and improve every aspect of your investments.

Join the betaHelp us

Functionalities

Position Charts
Sector Analysis
Risk Management
Profit and Loss
Positions
Evolution
Heatmaps
Dividends
Profitability Charts
The process

How it works

  1. Register

  2. Connect your accounts

  3. Setup your Finboard

  4. Analyze your investments

image-text

Lifetime Updates

Always improving our services and analyses.

Join the Beta
image-text

User interaction

Always listening to user's demands

Join the Beta
image-text

Skin in the game

We are developiing the product we wanted

Join the Beta

Plans & Pricing

Free
$0

Month

1 Wallet or exchange
✅ Unlimited actions
✅ Main functionalities
✅ Unlimited movements.
✅ Automatic Dividends and Splits
❌ Historical Dividends and Splits
❌ Automatic connections
❌ History of movements
❌ Automatic update of movements
❌ Advanced functionalities

Basic
$4.99

Month (paid yearly)

4 wallets or exchanges
✅ Multi-accounts
✅ Unlimited actions
✅ All the features
✅ Unlimited movements
✅ Automatic Dividends and Splits
✅ Historical Dividends and Splits
✅ Automatic connections
✅ History of movements
✅ Automatic update of movements
❌ Advanced functionalities

Premium
$9.99

Month (paid yearly)

Unlimited portfolios and exchanges
✅ Multi-accounts
✅ Unlimited actions
✅ All the features
✅ Unlimited movements
✅ Automatic Dividends and Splits
✅ Historical Dividends and Splits
✅ Automatic connections
✅ History of movements
✅ Automatic update of movements
✅ Advanced functionalities

Enterprise
$29.99

Month (paid yearly)

Unlimited portfolios and exchanges
✅ Multi-accounts
✅ Unlimited actions
✅ All the features
✅ Unlimited movements
✅ Automatic Dividends and Splits
✅ Historical Dividends and Splits
✅ Automatic connections
✅ History of movements
✅ Automatic update of movements
✅ Advanced functionalities
Business functionalities

JOIN THE BETA

Sign up now and be the first

Functionalities

Your Profitability calculated in the most accurate way.

A return that reflects the exact performance of your portfolio from the first day you invested. You have all cash flows in your accounts (Deposits, withdrawals, purchases and sales, commissions, interest…)You will also be able to visualize the evolution of your portfolio in absolute value.

Measure your results like a professional.

All portfolio management metrics that give the investor great information about the performance of their portfolios.

  • Profitability
  • Sharpe
  • Ratio sortino
  • Profit factor
  • Beta
  • Alpha

Asset allocation it’s one of the most important parts in portfolio analysis.

You will be able to analyze your portfolio with the following analyses:– Analysis by sectors
– Analysis by geography
– Analysis by Industries
– Analysis by assets
– Analysis by currency
-Analysis by size

Positions of your investment portfolio.

You will be able to visualize your positions in a clear and intuitive way with very visual graphics

  • Graphic of your portfolio
  • Statistics and metrics of the assets in your portfolio
  • Profitability of each asset
  • Metrics of closed positions
  • Table of closed movements with FIFO for taxation

You can automatically track your dividends.

Monitor your dividends from all your companies on a single platform and forget about dates and amounts

  • Dividend Yield
  • Annual estimate
  • Comparison with other years
  • Dividends collected
  • Detailed dividend table
  • Dividend schedule

Monitor your cryptocurrencies

High-quality analysis so you can make better decisions.

  • Profitability
  • Positions.
  • Losses and profits
  • Distribution of exchanges
Back to top